
Your EU customers pay for your emissions. Actual data usually costs them less.
From 2026 every tonne of fertilizer, steel, aluminum or cement entering the EU carries a carbon price. How much depends on your numbers: measured, or the EU's conservative defaults.
Free allocation falls every year from 2026
Certificates cover what free allocation does not. Each year less of the benchmark is free, so each tonne of embedded CO₂ costs more.
- 1 January 2026Definitive period starts. Importers above 50 t a year need authorized-declarant status.
- February 2027Certificate sales open for 2026 imports, priced at the quarterly average of EU ETS auctions.
- 30 September 2027First annual CBAM declaration for 2026 imports, with verified emissions where actual values are used.
- 2034Free allocation reaches zero.
Dates per Reg. (EU) 2023/956 as amended by Reg. (EU) 2025/2083.
What actual data is worth: one tonne of urea, 2026
Data used in the calculation
Basis: 1 t urea · import year 2026 · illustrative plant
- SEE, actual (direct + indirect)
- 1.117 t CO₂/t
- Ammonia in the urea
- 0.564 t NH₃/t
- Benchmarks, column A: urea · ammonia
- 0.053 · 1.522 t CO₂/t
- EU default (Egypt) × 1% mark-up
- 1.39 × 1.01 = 1.404
- Benchmark, column B · CBAM factor 2026
- 0.902 · 97.5%
Working
- Free allocation, actual = (0.053 + 0.564 × 1.522) × 97.5% = 0.889
- Certificates, actual = 1.117 − 0.889 = 0.228 t CO₂/t
- Free allocation, default = 0.902 × 97.5% = 0.879
- Certificates, default = 1.404 − 0.879 = 0.524 t CO₂/t
Difference: 0.296 certificates per tonne of urea
57% fewer certificates · about €22 per tonne of urea at €75/t CO₂
Benchmarks IR 2025/2620 · CBAM factor Dir. 2003/87/EC Art. 10a(1a) · CSCF = 1 for 2026–2030 (Decision 2026/1862) · Egypt default IR 2025/2621 as corrected by IR 2026/1740. Plant figures illustrative.
Seven steps, each signed off before the next
| Step | What happens |
|---|---|
| 1 · Scope | Goods, CN codes, the data request |
| 2 · Boundary | Installation and production processes |
| 3 · Process model | Mass, carbon and heat balances traced to the design documents |
| 4 · Metering | Every input mapped to a meter, or listed as a gap |
| 5 · Attribution | Heat, power and precursors per the annexes |
| 6 · Calculator | One workbook in; embedded emissions and checks out |
| 7 · Reporting | Monitoring plan, operator's report content, verifier pack |
Most of the work is steps 2 to 5. Get the boundary and the allocation right and the calculator is the easy part.
What lands on your desk at each gate
Typical scope: one installation, one reporting period, up to four product groups, about ten weeks in all. The technical lead runs every phase, with an associate engineer from your sector where it helps.
| Phase | Effort | We need from you | You receive |
|---|---|---|---|
| 0 · Applicability and reporting route | 3–5 days | CN codes and tonnes shipped to the EU, a block diagram, the data you already have | A short memo: goods in scope, actual against default values with the certificate cost both ways, the recommended route, what your EU importer needs, and a fixed quote for Phase 1 |
| 1 · Data and monitoring plan | 8–12 days | Design documents, meter list, one year of production, fuel and power figures, a contact at the plant for data questions | Data request, installation boundary, meter map and a monitoring plan with every open item marked |
| 2 · Calculation | 6–10 days | Answers to the open items, lab results and meter readings for the period | Results workbook: specific embedded emissions per CN code, direct and indirect, monthly and annual, with balances that close |
| 3 · Pre-verification | 4–6 days | Access to the people the verifier will talk to | Mock audit findings, operator's report content with an uncertainty estimate, and an evidence pack where every number points to its source |
Samples on an illustrative plant can be shown on the first call. Client files are never used as samples.
Five allocation traps in fertilizer plants
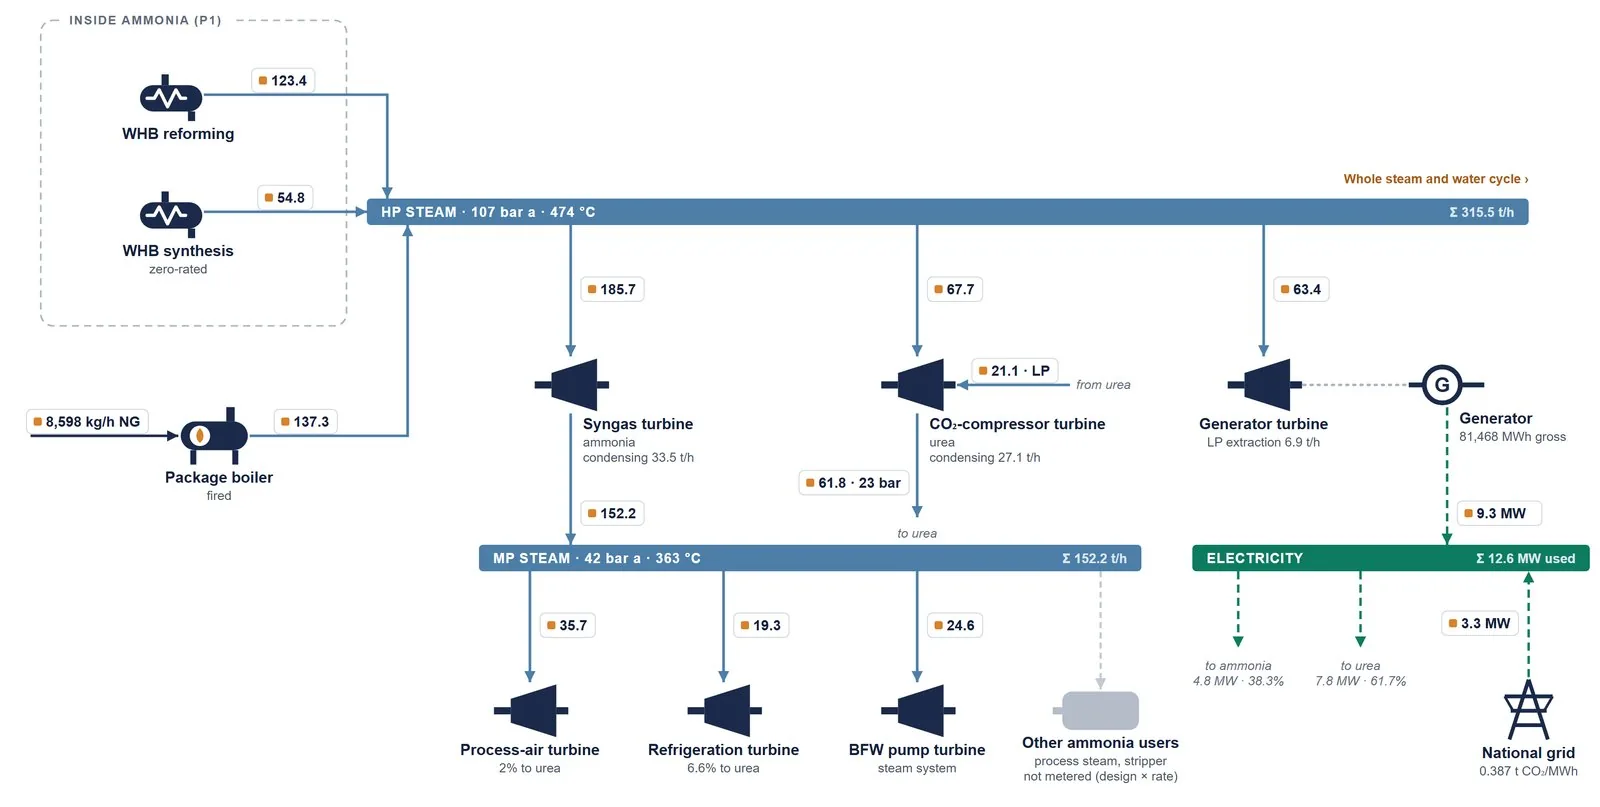
- Shared steam network. Charged by the heat each process uses, at the network's own factor.
- Steam leaving a process. At the fuel mix of the process that made it; 62.3 t CO₂/TJ if that cannot be shown.
- Reaction heat. Steam from the ammonia synthesis loop counts as zero, if it is metered on its own.
- Own generator. The grid default factor applies unless there is hourly evidence.
- Precursors. Ammonia takes its full embedded emissions into the urea or nitrate made from it.
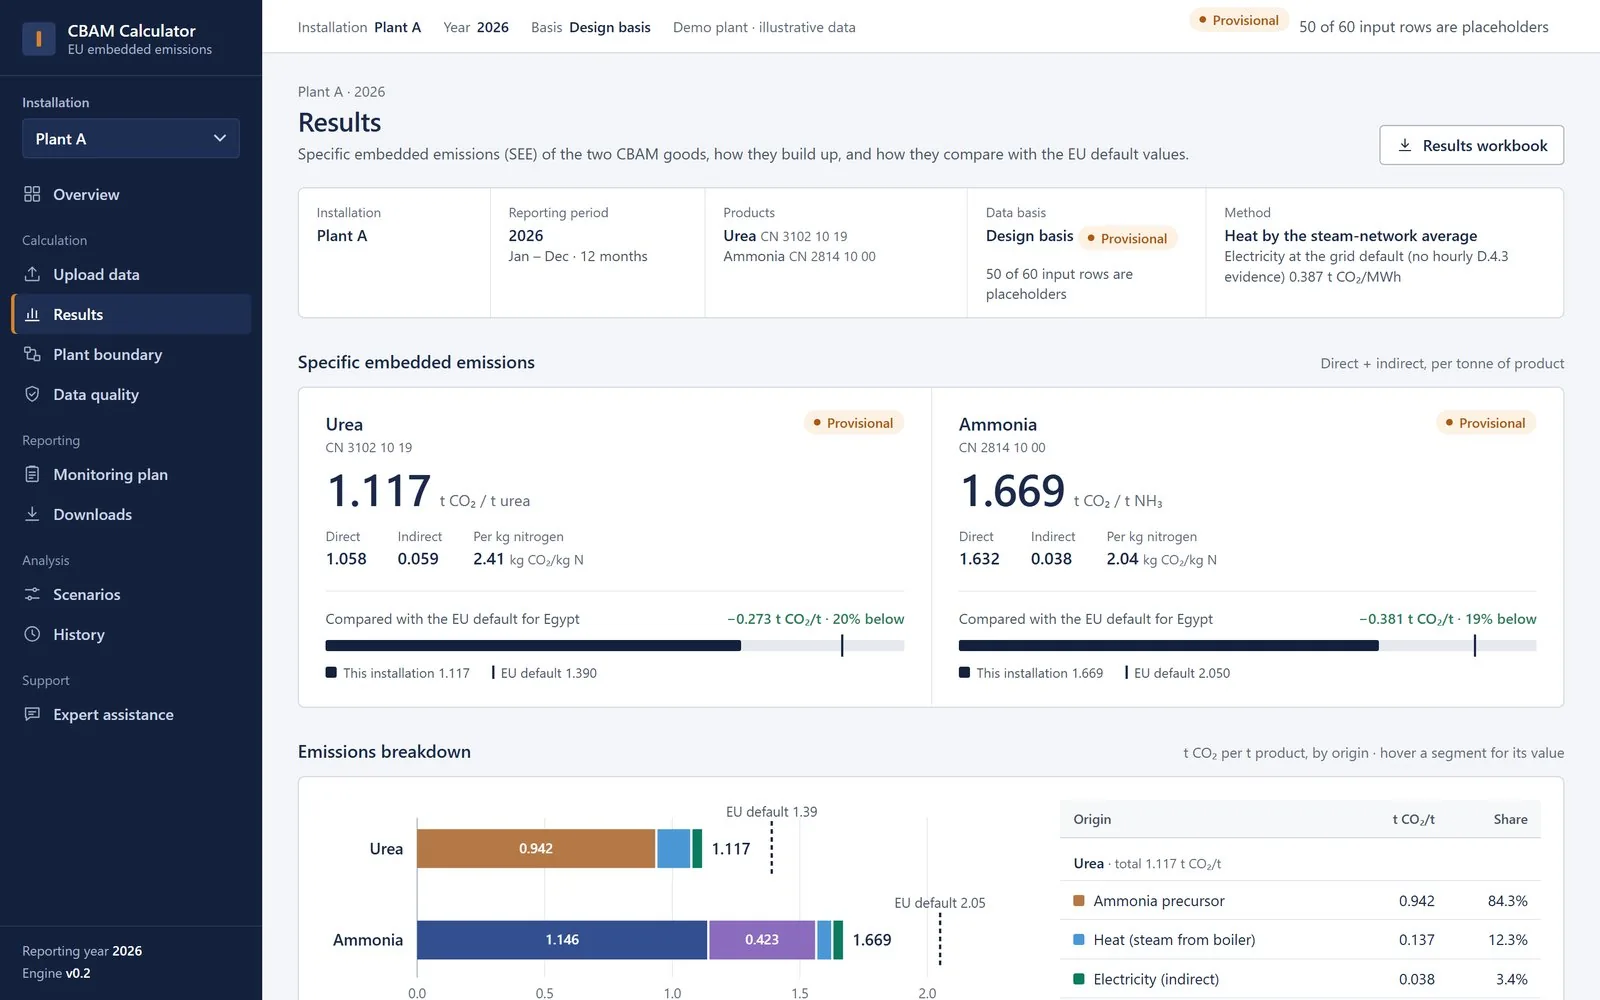
One workbook in, a verifier pack out
- Every row checked before anything is calculated; every run saved
- Placeholders stay visible on every screen until measured data replaces them
- Scenarios: carbon price, tonnage, import year, method choices
- Results workbook, boundary page, monitoring plan and operator's report from the same run
- Runs offline on your own computer: plant data never leaves the site
Checked before the verifier sees it, including the misses
| Test | Result | What it means |
|---|---|---|
| Legal text | 72 / 72 | Rule statements in the method checked against the official text; 8 deliberately false statements put in as controls, all rejected |
| Commission examples | 28 / 28 | Checks passed against the Commission's printed results: Guidance 5A cement (12), 5D blast furnace steel (9), 5D electric arc furnace steel (7). Four printing slips in 5D turned up on the way |
| Recalculation | 0.0025% | Largest difference between an independent recalculation and the tool, over 22 items |
| Uncertainty | ± 2.2% | On urea embedded emissions at the recommended metering; Monte Carlo, 20,000 runs. With weak metering, closer to ± 5% |
| Mock verification | 7 of 14 | Planted errors caught by the first version of the checks. The seven misses (drifting meters, swapped months, kWh for MWh) went straight onto the fix list |
Test cases: a synthetic ammonia-urea plant, synthetic cement and steel works, and the Commission's worked examples. Results on a real plant remain subject to its verifier.
Start with Phase 0: 3–5 days, fixed price.
You get the reporting route that costs your EU customers least, and a list of what it takes to get there.