
Emission allocation built from the plant, prepared for the verifier
Every service here ends in a calculation someone else can follow: inputs traced to meters, lab results, delivery tickets or EPDs, and every rule traced to its source.
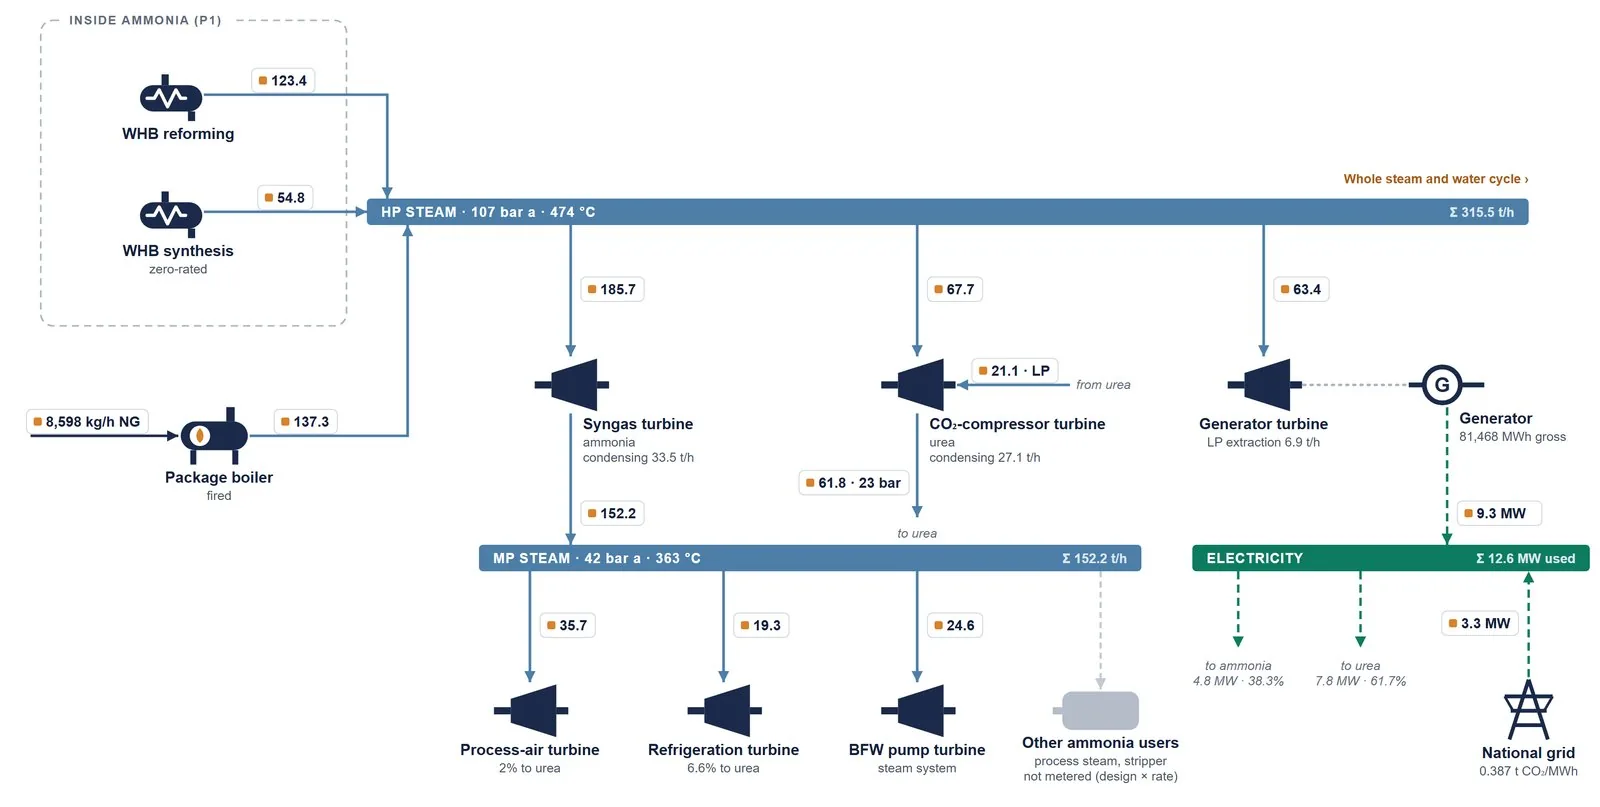
Emission allocation on complex sites
Most errors in CBAM, RFNBO and product footprints are not in the regulation. They are in how a shared site is split: which process carries the steam, the power, the by-product and the precursor.
- Shared steam networks and boilers, charged by the heat each process uses
- Own power generation versus grid power, with the evidence each rule asks for
- Precursors: ammonia into urea and nitrates, clinker into cement
- Co-processing green and gray hydrogen in one plant
- Co-products and mass, energy or economic allocation, written down and justified
Recent work by our technical lead includes allocation for a fertilizer producer and a cement producer preparing for CBAM.
CBAM
Since 1 January 2026, EU importers pay for the embedded emissions of fertilizers, iron and steel, aluminum, cement, hydrogen and electricity. They need installation data they can defend, and they get it from you. We build it with you.
The CBAM page: timeline, worked example, method and checks| Phase | Scope | Effort |
|---|---|---|
| 0 | Applicability and reporting route: actual values or defaults | 3–5 days |
| 1 | Data collection and monitoring plan | 8–12 days |
| 2 | Emissions calculation per CN code | 6–10 days |
| 3 | Verification readiness: mock audit and evidence pack | 4–6 days |
RFNBO and low-carbon fuels
A renewable fuel of non-biological origin must show at least 70% GHG savings against 94 g CO₂e/MJ, with renewable electricity that meets the additionality and correlation rules. The hardest cases are brownfield: green hydrogen fed into an existing ammonia plant.
- GHG model, cradle to grave, with the regulatory factors built in
- Renewable power evidence: PPAs, additionality, hourly matching
- Co-processing: which share of the product can count as RFNBO
- Readiness for voluntary certification schemes, and offtake GHG clauses
From our technical lead's recent work
RFNBO eligibility of a brownfield ammonia plant adding a green hydrogen stream, with its GHG model and audited precertification. GHG terms written into an offtake agreement.
Names withheld. See Experience.
GHG inventory, Scope 1-2-3
Scope 1 and 2
Fuels, process emissions, flaring, refrigerants, purchased power and steam, with plant and grid factors, to the GHG Protocol or ISO 14064-1.
Scope 3
The categories that matter for your business, starting with purchased goods, capital goods, transport and use of sold products.
Prepared for verification
Boundary, data trail, factors and uncertainty written down so a third-party verifier can follow every line.
Product carbon footprint and EPD support
Buyers in Europe and the US now ask suppliers for the footprint of one product, not the whole company. We calculate it to ISO 14067, cradle to gate, with the allocation choices written down, and prepare the data an EPD program operator will ask for.
Construction embodied carbon (US)
Data-center and industrial owners ask contractors for monthly as-built quantities matched to EPDs and GWP values. We run the tracker, check each EPD before its number is used (product, plant, validity, declared unit, modules), and deliver the owner's report.
Pilot: one building, one month. You send the owner's template, quantities installed to date, and the submittals and EPDs received so far. You receive the filled template, an EPD evidence register, the month's as-built report and a supplier action list.
Decarbonization roadmaps and energy audits
Energy and utilities audits
Steam, power, compressed air and cooling, audited by engineers who ran them. Fuel saved is emissions saved, and both are counted.
Roadmaps
Reduction options per plant with cost per tonne avoided, a realistic timeline, and what each step does to your CBAM or footprint number.
Climate data for ESG reports
Sustainability and annual reports need a climate section that matches the inventory behind it. We prepare the emission figures, targets and methods for the frameworks you report under, so the numbers in the report and in the inventory are the same.
Pre-verification
A mock audit before the real one: the verifier's checklist applied to your data, planted-error tests on the calculation, and an evidence pack ready for the site visit.
Start with Phase 0: 3–5 days, fixed price.
You get the reporting route that costs your EU customers least, and a list of what it takes to get there.